Microsoft’s Excel is ubiquitous in finance. The current version (version 2105) provides the Surface chart type, with four varieties of the chart: 3-D Surface, Wireframe 3-D Surface, Contour, and Wireframe Contour. The underlying data is provided as a rectangular grid or, rather, a list of series of data. The names of the series provide the categories for the y axis, listed from front to back. A range containing axis labels provides the categories for the x axis.
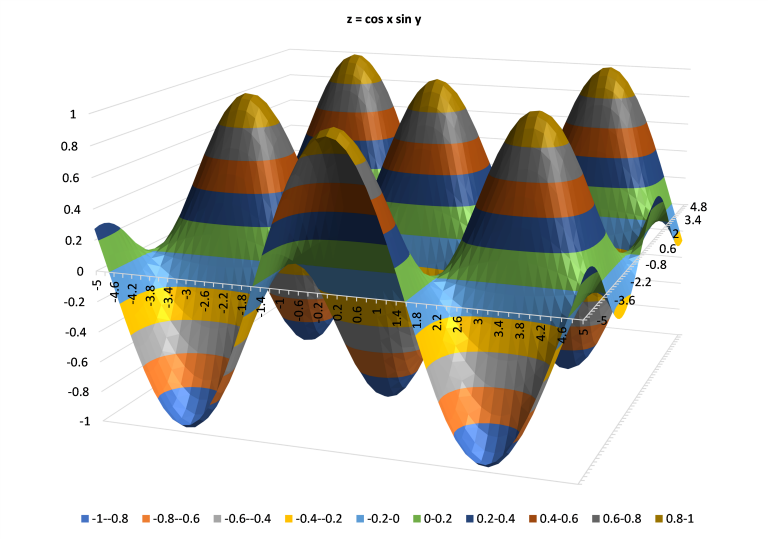
For example, the Excel chart below was created using (almost) default settings from a grid of 51 series of 51 values, the names of the y axis series being -5, -4.8 to 5 and the x axis categories being -5, -4.8 to 5. The z axis banding is based on the major units for that axis, selected automatically in this example. The chart was created sized 768 px by 539 px (at 96 px per inch) and using Calibri 10 pt font.
I wondered what Haskell packages might offer in competition.
gnuplot
Haskell package gnuplot provides 3D plots, through a wrapper around the gnuplot application. The package’s own description refers to alternative packages: plot (2D only), HPlot (an apparently obsolete interface to the PLplot library), Chart (2D only), textPlot (2D only), and easyPlot (another wrapper around gnuplot).
The gnuplot application is cross-platform, including Windows 10. Windows binaries are available for version 5.4.1, but bugs mean that version 5.2.8 is recommended as a work around.
gnuplot has different options for its output, referred to as terminals. Some terminals are interactive, such as wxt (the default), windows and qt. Other terminals are file formats, such as svg (Scalable Vector Graphics).
The gnuplot chart below was created using the svg terminal at size 768 px by 543 px with the Calibri 13.33 px (equivalent to 10 pt) font and almost default settings, as follows:
|
1 2 3 4 5 6 |
set samples 51 # The default is 100 set isosamples 51 # The default is 10 set xrange [-5:5] # The default is [-10:10] set yrange [-5:5] set pm3d lighting # The default is nolighting splot cos(x) * sin(y) with pm3d # pm3d is a surface plot style |

Unlike Excel, which provides perspective projections, only orthogonal projections are available. Unlike Excel, which colours the surface by reference to z axis bands, each facet of the surface is coloured by reference to a spectrum, shown in a colour box. By default, the xy plane is drawn below the z axis range, 50% lower than the range.
Options can be set to change the format of the chart:
|
1 2 3 4 5 |
unset key set title "z = cos x sin y" font "Calibri Bold" set colorbox horizontal user origin 0.1, 0.1 size 0.8, 0.04 set xyplane relative 0 splot cos(x) * sin(y) with pm3d |

gnuplot-0.5.6.1
The Haskell package gnuplot-0.5.6.1 does not work on Windows 10 out of the box. That is because the source code assumes the existence of an executable pgnuplot. pgnuplot.exe stopped being distributed from version 5.0, released in January 2015. The executable is named gnuplot.exe. I forked the source code and applied a fix.
The svg terminal is implemented in module Graphics.Gnuplot.Terminal.SVG, but not the size or font options. I implemented the options.
Some options are coded in module Graphics.Gnuplot.Frame.Option. Others (for example, colorbox and xyplane) can be constructed using custom. The setting of some options is coded in Graphics.Gnuplot.Frame.OptionSet. Others (for example set title "<title-text>" font "<font>") can be set using functions like add or addBool.
The surface function is the wrapper around splot with pm3d. It creates grid data in a temporary file.
The function fileContents allows the generated gnuplot script to be inspected.
The Haskell equivalent of the example chart above is as follows.
|
1 2 3 4 5 6 7 8 9 10 11 12 13 14 15 16 17 18 19 20 21 22 23 24 25 26 27 28 29 30 31 32 33 34 35 36 37 |
module Main where import qualified Graphics.Gnuplot.Advanced as GP import qualified Graphics.Gnuplot.Frame as Frame import qualified Graphics.Gnuplot.Frame.Option as Option import qualified Graphics.Gnuplot.Frame.OptionSet as Opts import qualified Graphics.Gnuplot.Graph.ThreeDimensional as Graph3D import qualified Graphics.Gnuplot.Plot.ThreeDimensional as Plot3D import Graphics.Gnuplot.Terminal.SVG (cons, font, size) colorbox :: Option.T colorbox = Option.custom "colorbox" "" xyplane :: Option.T xyplane = Option.custom "xyplane" "" cosSin :: Frame.T (Graph3D.T Double Double Double) cosSin = Frame.cons ( Opts.addBool (Option.pm3d "lighting") True $ Opts.key False $ Opts.add Option.title ["\"z = cos x sin y\"", "font \"Calibri Bold\""] $ Opts.add colorbox ["horizontal", "user", "origin 0.1, 0.1", "size 0.8, 0.04"] $ Opts.add xyplane ["relative 0"] $ Opts.xRange3d (-5.0, 5.0) $ Opts.yRange3d (-5.0, 5.0) $ Opts.deflt ) $ Plot3D.surface meshNodes meshNodes (\x y -> cos x * sin y) where meshNodes = Plot3D.linearScale 50 (-5.0, 5.0) main :: IO () main = do let term = size 768 543 $ font "Calibri" (Just 13.33) $ cons "example.svg" _ <- GP.plot term cosSin let (script, _) = GP.fileContents "" term cosSin putStrLn script |
The gnuplot script that it generates is as follows:
|
1 2 3 4 5 6 7 8 9 10 11 |
set terminal svg size 768,543 font "Calibri,13.33" set output "example.svg" set colorbox horizontal user origin 0.1, 0.1 size 0.8, 0.04 unset key set pm3d lighting set title "z = cos x sin y" font "Calibri Bold" set xrange [-5.0:5.0] set xyplane relative 0 set yrange [-5.0:5.0] unset zdata splot "curve0.csv" using 1:2:3 with pm3d |
However, the resulting SVG file reveals that the results are not identical. The identical placement of the colour box overlaps slightly the chart, which can be seen to be oriented very slightly differently.
